Healthcare policy in Georgia
This article does not contain the most recently published data on this subject. If you would like to help our coverage grow, consider donating to Ballotpedia.
| Healthcare policy in Georgia | |
|
| |
| State overview | |
| State population: 9,787,100 | |
| Percent uninsured: 16% | |
| Total healthcare spending: $53,655,492,000 | |
| Percent of gross state product: 13.7% | |
| Total Medicaid spending: $8,525,953,526 | |
| Total Medicare spending: $11,742,520,000 | |
| Median annual income: $47,753 | |
| Average family premium: $14,762 | |
| Average employee contribution: $4,435 | |
| Percent of income: 9.3% | |
| State healthcare policy | |
| Alabama • Alaska • Arizona • Arkansas • California • Colorado • Connecticut • Delaware • Florida • Georgia • Hawaii • Idaho • Illinois • Indiana • Iowa • Kansas • Kentucky • Louisiana • Maine • Maryland • Massachusetts • Michigan • Minnesota • Mississippi • Missouri • Montana • Nebraska • Nevada • New Hampshire • New Jersey • New Mexico • New York • North Carolina • North Dakota • Ohio • Oklahoma • Oregon • Pennsylvania • Rhode Island • South Carolina • South Dakota • Tennessee • Texas • Utah • Vermont • Virginia • Washington • West Virginia • Wisconsin • Wyoming | |
Healthcare policy in the U.S. • Medicare • Medicaid • Obamacare overview | |
| Years of data (most recent available as of August 2015): •2013: State population, percent uninsured, median annual income, average family premium, average employee contribution, and percent of income. •2012: Total Medicaid spending. •2009: Total healthcare spending, percent of gross state product, and total Medicare spending. | |
Healthcare policy in Georgia involves the creation and implementation of laws, rules, and regulations for managing the state's healthcare system. The healthcare system consists of services provided by medical professionals to diagnose, treat, and prevent mental and physical illness and injury. The system also encompasses a wide range of related sectors, such as insurance, pharmaceuticals and health information technology.
According to the National Conference of State Legislatures, the 50 state legislatures collectively "make thousands of health policy decisions each year," not including the decisions made by local governments, which often oversee hospitals, and private bodies, such as insurers. These decisions can include budget appropriations, requirements for doctors obtaining their licenses, which services are covered by insurance, how personal health information is managed, and which immunizations children must receive, among many others.[1]
Healthcare policy affects not only the cost citizens must pay for care, but also their access to care and the quality of care received, which can influence their overall health. A top concern for policymakers is the rising cost of healthcare, which has placed an increasing strain on the disposable income of consumers as well as on state budgets.
Other issues in healthcare policy include
- state Medicaid expansion,
- health information technology and privacy,
- uninsured and underinsured portions of the population,
- a shortage of primary care physicians, and
- mental healthcare access and coverage.
Background
In the early years of the United States, healthcare was provided by wives and mothers in the home, with occasional home visits by doctors. Medical colleges were established starting in the late 1700s, providing formal scientific training and licensing to physicians. The role of doctors became more authoritative and pronounced with further advancements in science and the growth of cities, which presented health hazards due to overcrowding, poor sanitation and attendant disease.[2][3][4]

In 1846 a group of physicians formed the American Medical Association (AMA) with the early mission of (and achievement of) state regulation of pharmaceuticals. As medicine grew more professionalized, private health insurance pools were established, and employers and unions began offering some medical benefits to workers. The model of payment known as "fee-for-service," in which doctors are paid for each treatment, test and office visit, emerged.[2]
Though once housing primarily very poor, terminally ill patients, hospitals evolved to more closely resemble the institutions they are today. This was in part due to the development of antiseptics—allowing for more sanitary treatment conditions—and better education of physicians. It was also partly due to their role in the development of employer-sponsored insurance by offering plans for public school teachers, which allowed them to go to hospitals for more routine treatments. The employer-sponsored insurance model spread during World War II, when government wage controls prompted employers to offer health benefits rather than higher salaries in order to attract workers. This model grew more popular after the war when payments by employers toward employee health insurance were made tax-exempt.[2][5][6]
Throughout the mid-20th century, Congress established federal agencies dedicated to healthcare policy, including the National Institutes of Health and the Centers for Disease Control, the Food and Drug Administration, and the Department of Health and Human Services. The federal government also enacted a number of pieces of healthcare legislation during the second half of the century:

- Social Security Amendments of 1965, which established Medicare and Medicaid
- Health Maintenance Organization Act of 1973, which promoted prepaid group practice service plans known as health maintenance organizations (HMOs) as an alternative to fee-for-service plans
- Consolidated Omnibus Budget Reconciliation Act of 1985, which allowed employees to continue healthcare coverage if they would otherwise lose it (due to job loss, medical leave, etc.)
- Health Insurance Portability and Accountability Act of 1996, which limited the extent to which insurance companies could exclude people with preexisting conditions
- Patient Protection and Affordable Care Act of 2010, known as Obamacare, which established health insurance exchanges and required all citizens to obtain health insurance
Though there have been steady calls for a national health insurance program since the early 1900s, no such measure has been adopted in the United States.[2]
Today, the healthcare industry is an immense part of the nation's economy. Healthcare spending amounts to about one-sixth of the nation's gross domestic product and health expenditures account for about one-fourth to one-third of state budgets. Healthcare regulation and policy is complex, with nearly "every aspect of the field ... overseen by one regulatory body or another, and sometimes by several." Such regulations are enforced by federal, state and local governments, and even private organizations. The 2010 passage of Obamacare introduced experimentation and uncertainty into the industry, which will be watched closely over the next several years to gauge the lasting effects of its policies.[1][7][8][9]
| Back to top↑ |
General information
| Terms and definitions | |
| Hover over each term to display a definition. | |
| Fee-for-service | |
| Gross domestic product | |
| Gross state product | |
| Managed care | |
| Medical durables | |
| Medical nondurables | |
| National health insurance | |
| Premium | |
| Scheduled drugs | |
The tables below compare demographic and economic statistics for Georgia and surrounding states, since both factors significantly impact healthcare and healthcare policy. Also provided is general information on the insurance coverage of individuals in each state.
Demographics
A major concern for the healthcare industry is the shifting demographic makeup of the nation and its states. Different groups of people—such as men and women, for example—tend to use different health services.In particular, persons aged 65 and older comprise an increasing share of the total population, with that share expected to reach 20.2 percent by 2050. This trend has had a part in the increase in demand for healthcare services and the related increase in costs. It will also influence the federal budget, as more and more seniors join Medicare.[10]
Compared to neighboring states, Georgia had the smallest percentage of its population that was age 65 and over in 2013. It also had the largest percentage that was age 18 and under.[11][12][13]
| Age and gender demographics, 2013 | ||||||||
|---|---|---|---|---|---|---|---|---|
| State | Total residents | Children 0-18 | Adults 19-64 | 65+ | Male | Female | ||
| Georgia | 9,787,100 | 27% | 60% | 13% | 48% | 52% | ||
| Alabama | 4,755,200 | 25% | 60% | 15% | 48% | 52% | ||
| Florida | 19,379,400 | 22% | 61% | 17% | 48% | 52% | ||
| South Carolina | 4,683,900 | 24% | 59% | 17% | 48% | 52% | ||
| United States | 313,395,400 | 25% | 61% | 14% | 49% | 51% | ||
| Source: The Henry J. Kaiser Family Foundation, "State Health Facts" | ||||||||
Economic indicators
- See also: Economic indicators by state
Broadly defined, a healthy economy is typically one that has a "stable and strong rate of economic growth" (gross state product, in this case) and low unemployment, among many other factors. The economic health of a state can significantly affect its healthcare costs, insurance coverage, access to care, and citizens' physical and mental health. For instance, during economic downturns, employers may reduce insurance coverage for employees, while those who are laid off may lose coverage altogether. Individuals also tend to spend less on non-urgent care or postpone visits to the doctor when times are hard. These changes in turn may affect the decisions made by policymakers as they react to shifts in the industry. Additionally, a person's socioeconomic status has profound effects on their access to care and the quality of care received.[14][15][16]
Although in September 2014 Georgia had the highest unemployment rate among its neighboring states, it also had the highest median annual household income between 2011 and 2013. In 2013, most Georgia residents earned incomes that were between 200 and 399 percent above the federal poverty level.[17][18][19][20]
Note: Gross state product (GSP) on its own is not necessarily an indicator of economic health; GSP may also be influenced by state population size. Many factors must be looked at together to assess state economic health.
| Various economic indicators by state | ||||||||
|---|---|---|---|---|---|---|---|---|
| State | Distribution of population by FPL* (2013) | Median annual income† | Unemployment rate | Total GSP (2013)‡ | ||||
| Under 100% | 100-199% | 200-399% | 400%+ | Sept. 2013 | Sept. 2014 | |||
| Georgia | 16% | 21% | 32% | 31% | $47,753 | 8% | 7.9% | $454,532 |
| Alabama | 17% | 22% | 33% | 28% | $43,330 | 6.4% | 6.6% | $193,566 |
| Florida | 15% | 20% | 32% | 32% | $47,106 | 6.9% | 6.1% | $800,492 |
| South Carolina | 16% | 19% | 35% | 30% | $43,716 | 7.3% | 6.6% | $183,561 |
| United States | 15% | 19% | 30% | 36% | $52,047 | 7.2% | 5.9% | $16,701,415 |
| * Federal Poverty Level. "The U.S. Census Bureau's poverty threshold for a family with two adults and one child was $18,751 in 2013. This is the official measurement of poverty used by the Federal Government." † Median annual household income, 2011-2013. ‡ In millions of current dollars. "Gross State Product is a measurement of a state's output; it is the sum of value added from all industries in the state." Source: The Henry J. Kaiser Family Foundation, "State Health Facts" | ||||||||
Insurance coverage
- See also: Health insurance coverage by source
In general, employers have been the dominant source of health insurance for individuals since the late 1940s and 1950s. This can be at least partially attributed to the income tax exemption granted to employers for payments made toward health insurance for employees. The second major sources of health insurance are the state and federal governments, which jointly provide Medicaid for low-income individuals while the federal government sponsors Medicare for the elderly and disabled.[21]
In 2013, about 47 percent of Georgia residents received health insurance through an employer, the highest percentage among neighboring states. The state had the smallest percentages of residents that were insured through Medicaid and Medicare, 13 percent and 14 percent, respectively.[22]
| Health insurance coverage by source, 2013 | ||||||
|---|---|---|---|---|---|---|
| State | Employer | Other private | Medicaid | Medicare | Other public | Uninsured |
| Georgia | 47% | 6% | 13% | 14% | 4% | 16% |
| Alabama | 43% | 5% | 17% | 18% | N/A | 16% |
| Florida | 41% | 5% | 14% | 17% | 3% | 19% |
| South Carolina | 46% | 4% | 14% | 19% | 2% | 15% |
| United States | 48% | 6% | 16% | 15% | 2% | 13% |
| Source: The Henry J. Kaiser Family Foundation, "State Health Facts" | ||||||
The 1980s saw a peak in the percentage of people who were receiving health coverage through their employers, with a continuous decline in the rate thereafter. A study by researchers at the University of Minnesota’s State Health Access Data Assistance Center, which was funded by the Robert Wood Johnson Foundation, found that despite the tax exemption, fewer employers are choosing to offer health coverage to their employees, and when it is offered, fewer employees are enrolling.[21][23]
From 2000 to 2012, Georgia experienced a drop of 14.1 percentage points in employer-sponsored health insurance, a greater drop than in neighboring states. Meanwhile, Medicaid enrollment increased by 4.2 percentage points and Medicare enrollment increased by 2.1 percentage points. Click 'show' on the table below to view more comparisons.[24]
| Change in health insurance coverage by source, 2000-2012 | ||||
|---|---|---|---|---|
| State | Change (in percentage points) | |||
| Medicaid enrollment | Employer-sponsored insurance | Medicare enrollment | Uninsured rate | |
| Georgia | 4.2 | -14.1 | 2.1 | 5 |
| Alabama | 6.3 | -9.7 | 5.4 | 2.5 |
| Florida | 5.7 | -12.4 | 1.3 | 5.2 |
| South Carolina | 0.6 | -10.3 | 1.8 | 3.5 |
| United States | 5.8 | -10 | 2.2 | 2.3 |
| Source: The Pew Charitable Trusts, "State Health Care Spending on Medicaid" | ||||
| Back to top↑ |
Spending and costs
- See also: Total healthcare spending by state
Healthcare spending and costs have become a top priority for both state and federal legislators amid growing concern from consumers and employers. Healthcare spending as a percentage of the national gross domestic product (GDP) increased from 5 percent in 1960 to reach 17.4 percent in 2009, or over one-sixth of the nation's economy, where it remained steady through 2013. Total healthcare spending in both the public and private sectors amounted to $2.9 trillion in 2013. Federal, state and local governments were responsible for about 43 percent of that spending. Projections have shown that if healthcare spending continues to increase at its current rate, it will reach 19.3 percent of GDP in 2023.[25][26][27][28]
The rise in spending has been attributed partially to increased demand, but in large part to the increased price of delivering and receiving care.
| “ |
Between January 1988 and January 2009, the consumer price index (CPI) rose 82 percent, while the medical component of CPI rose 175 percent.[29] |
” |
| —National Conference of State Legislatures | ||
Such costs mean less disposable income for consumers, greater expenses to hire new employees for employers, and difficulty writing budgets for lawmakers.[30][31]
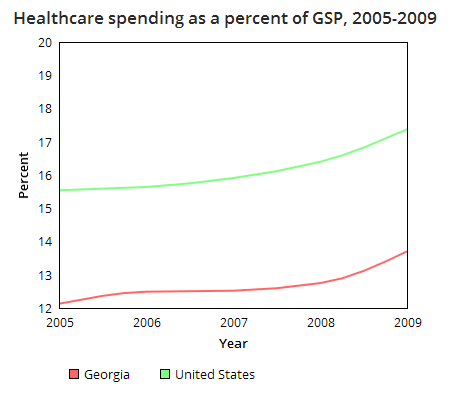
In 2009, the most recent year for which state-level data are available, total healthcare spending nationwide was $2.5 trillion. In Georgia, total healthcare spending amounted to $53.7 billion, 13.7 percent of gross state product (GSP), the smallest portion of GSP among neighboring states. Total spending came out to about $5,467 per person, lowest among neighboring states.[32][33][34]
| Total healthcare spending*, 2009 | ||||
|---|---|---|---|---|
| State | Total health spending (in millions) | Percent of GSP | Health spending per capita | Avg. annual percent growth† |
| Georgia | $53,655 | 13.7% | $5,467 | 6.6% |
| Alabama | $29,524 | 17.9% | $6,272 | 5.9% |
| Florida | $132,463 | 18.2% | $7,156 | 6.9% |
| South Carolina | $28,798 | 18.4% | $6,323 | 7.3% |
| United States‡ | $2,505,800 | 17.4% | $8,175 | 6.8% |
| * "Total Health Spending includes spending for all privately and publicly funded personal health care services and products (hospital care, physician services, nursing home care, prescription drugs, etc.) by state of residence. Hospital spending is included and reflects the total net revenue (gross charges less contractual adjustments, bad debts, and charity care)." † 1991–2009 ‡ Data come directly from the Centers for Medicare and Medicaid Services, "NHE Summary including share of GDP, CY 1960-2013" Source: The Henry J. Kaiser Family Foundation, "State Health Facts" | ||||
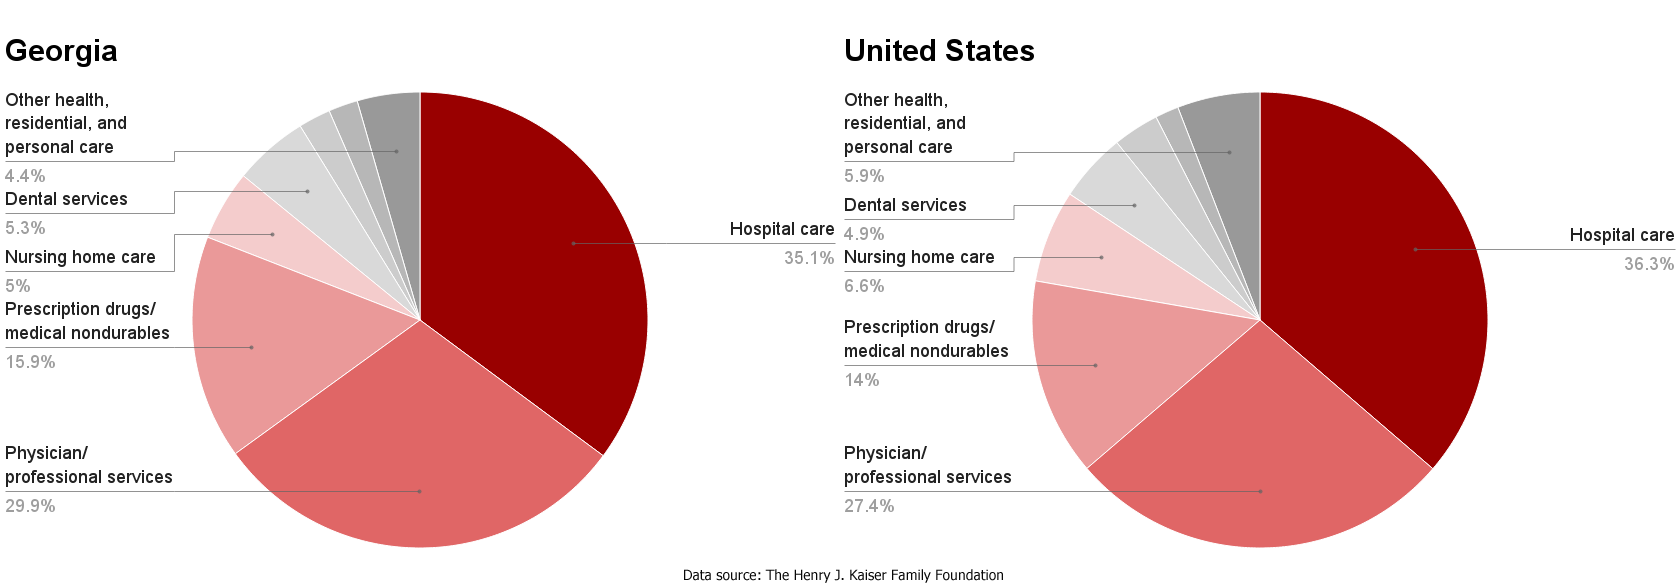
About 35 percent of Georgia's total healthcare spending went towards hospital care. Another 30 percent went towards physician and professional services. Spending in Georgia was similar to national trends, although a slightly smaller portion was spent on other health, residential and personal care services in the state.[35]
| Back to top↑ |
Government spending
- See also: Georgia state budget and finances
Medicaid and Medicare
Medicaid
- See also: Medicaid spending in Georgia
During fiscal year 2012, combined federal and state spending for Medicaid, a government health insurance program primarily for low-income and disabled persons, was higher in Georgia than in all of its neighboring states except for Florida, totaling about $8.5 billion. Medicaid spending per enrollee in Georgia amounted to $6,524, highest among neighboring states. The federal government contributed about 66 percent of funding to the program, while state funds accounted for the remaining 34 percent. Between 2000 and 2012, Medicaid spending grew at an average annual rate of 3.6 percent.[36][37][38][39][40]
| Medicaid spending, fiscal year 2012 | |||||||
|---|---|---|---|---|---|---|---|
| State | Total spending*† | Per enrollee*† | Total growth‡ | Compound annual growth rate‡ | Federal share* | State share* | Percent of state budget |
| Georgia | $8,525,953,526 | $6,524 | 53% | 3.6% | 66% | 34% | 21.5% |
| Alabama | $5,027,020,046 | $4,847 | 47% | 3.2% | 69% | 31% | 23.3% |
| Florida | $17,906,910,735 | $5,111 | 82% | 5.1% | 56% | 44% | 30.6% |
| South Carolina | $4,847,913,428 | $5,148 | 36% | 2.6% | 70% | 30% | 21.7% |
| United States | $415,154,234,831 | $6,833 | 63% | 4.1% | 57% | 43% | N/A |
| * "Expenditures do not include administrative costs, accounting adjustments, or the U.S. Territories." † Includes both state and federal expenditures. ‡ 2000–2012. Includes payments for services, administrative expenses, and DSH payments. | |||||||
Acute care services are those that are typically provided within a short time frame, such as inpatient hospital stays, lab tests and prescription drugs. Long-term care services, on the other hand, are those provided over a long period of time, such as home care and mental health treatment. Disproportionate Share Hospital (DSH) payments are funds given to hospitals that tend to serve more low-income and uninsured patients than other hospitals. The bulk of Medicaid spending in Georgia was on acute care services. About 4.9 percent of Medicaid spending went toward DSH payments, while the remaining 26.2 percent went toward long-term care services.[41]
In 2010, there were 1,869,622 Georgia residents enrolled in Medicaid. The majority of spending, 59 percent, was on the elderly and disabled, who made up 25 percent of Medicaid enrollees. This is typical of most states, since this group of enrollees is "more likely to have complex health care needs that require costly acute and long-term care services," according to the Pew Charitable Trusts. The proportion of these individuals who are enrolled in Medicaid is taken into consideration when lawmakers make appropriations for the program each year.[42]
| Distribution of Medicaid enrollment and payments, 2010 | ||||||
|---|---|---|---|---|---|---|
| State | Enrollment rates | Payment for services | ||||
| Total | Elderly and disabled individuals | Parents and children | Total (in billions) | Elderly and disabled individuals | Parents and children | |
| Georgia | 1,869,622 | 25% | 75% | $7.3 | 59% | 41% |
| Alabama | 1,015,576 | 33% | 67% | $4.2 | 60% | 40% |
| Florida | 3,703,388 | 28% | 72% | $16.4 | 67% | 33% |
| South Carolina | 922,560 | 26% | 74% | $4.7 | 63% | 37% |
| United States | 66,390,642 | 24% | 76% | $369.3 | 64% | 36% |
| Source: The Pew Charitable Trusts, "State Health Care Spending on Medicaid" | ||||||
Medicare
Medicare is a federal health insurance program for elderly persons over age 65 and younger individuals with certain disabilities. Medicare accounted for 14 percent of the federal budget in 2013. In 2009, the most recent year for which state spending data is available, total federal Medicare spending for enrollees in Georgia amounted to $11.7 billion, or $9,836 per enrollee. Per enrollee Medicare spending experienced a slower average annual rate of growth in Georgia between 1991 and 2009 than in neighboring states.[43][44][45][46]
| Medicare spending and growth, 2009 | ||||||
|---|---|---|---|---|---|---|
| State | Total (in millions) | Average annual growth rate* | Per enrollee | Average annual growth rate* | ||
| Georgia | $11,743 | 8.6% | $9,836 | 5.8% | ||
| Alabama | $8,042 | 7.9% | $9,718 | 5.9% | ||
| Florida | $39,119 | 8.6% | $11,893 | 6.7% | ||
| South Carolina | $7,211 | 10.4% | $9,632 | 7.4% | ||
| United States | $471,260 | 8.0% | $10,362 | 6.4% | ||
| * 1991–2009 Source: The Henry J. Kaiser Family Foundation, "State Health Facts" | ||||||
In 2012, there were 1,318,733 individuals in Georgia enrolled in Medicare, or 13.4 percent of the state population. Aged beneficiaries made up 78.4 percent of the total number, while 21.6 percent were disabled.[47][48][49]
| Medicare beneficiaries, 2012 | |||||
|---|---|---|---|---|---|
| State | Number | Percent of population | Eligibility category | ||
| Aged | Disabled | ||||
| Georgia | 1,318,733 | 13.4% | 78.4% | 21.6% | |
| Alabama | 881,686 | 18.4% | 72.7% | 27.3% | |
| Florida | 3,527,830 | 18.5% | 84.8% | 15.2% | |
| South Carolina | 820,947 | 17.5% | 77.7% | 22.3% | |
| United States | 49,435,610 | 16.0% | 81.4% | 18.6% | |
| Source: The Henry J. Kaiser Family Foundation, "State Health Facts" | |||||
Dual eligibility
Some individuals, such as low-income seniors, are eligible for both Medicare and Medicaid; these individuals are known as dual-eligible beneficiaries. For those enrolled in Medicare who are eligible, enrolling in Medicaid may provide some benefits not covered by Medicare, such as stays longer than 100 days at nursing facilities, prescription drugs, eyeglasses, and hearing aids. Medicaid may also be used to help pay for Medicare premiums. Total Medicaid spending for dual eligibles in Georgia amounted to $2.3 billion. Most payments were made toward long-term care.[50][51]
| Medicaid spending for dual eligibles by service, fiscal year 2011 (in millions) | ||||||
|---|---|---|---|---|---|---|
| State | Medicare premiums | Acute care | Prescribed drugs | Long-term care | Total | |
| Georgia | $295 | $366 | $26 | $1,596 | $2,283 | |
| Alabama | $250 | $245 | $13 | $1,125 | $1,633 | |
| Florida | $1,122 | $1,927 | $87 | $4,054 | $7,190 | |
| South Carolina | $172 | $495 | $18 | $948 | $1,633 | |
| United States | $13,489 | $40,190 | $1,462 | $91,765 | $146,906 | |
| Source: The Henry J. Kaiser Family Foundation, "State Health Facts" | ||||||
| Back to top↑ |
Prison healthcare
- See also: Prison healthcare
In 1976, the United States Supreme Court ruled that adequate healthcare for prisoners is a constitutional right and that the refusal to provide them with such violates the Eighth Amendment prohibiting cruel and unusual punishment. As such, state budget allocations for correctional facilities, like other healthcare expenditures, have continued to grow, especially as the prison population ages. Correctional healthcare spending nationwide totaled $7.7 billion in 2011, or $6,047 per inmate, which The Pew Charitable Trusts estimated to be about one-fifth of total prison spending. This was up from 2007, but down from a peak in 2009 as the average daily prison population decreased. States have experienced fiscal pressure to manage prison healthcare costs without compromising prisoners' right to quality care.[52]
| “ |
The manner in which states manage prison health care services that meet these legal requirements affects not only inmates' health, but also the public's health and safety and taxpayers' total corrections bill.[29] |
” |
| —The Pew Charitable Trusts | ||
In 2011, total spending on prison healthcare in Georgia totaled approximately $208.1 million, an increase of 1 percent from 2007. Meanwhile, the average daily prison population declined by 4 percent. This may have contributed to a rise in per-inmate spending of 5 percent, which reached $4,018 in 2011. Georgia had a similar percentage of inmates age 55 and over as Alabama, 7.9 percent.[52]
| State spending on prison healthcare | |||||||
|---|---|---|---|---|---|---|---|
| State | Category | 2007 | 2008 | 2009 | 2010 | 2011 | Percent change |
| Georgia | Total spending* | $206,094 | $229,106 | $215,069 | $207,282 | $208,103 | 1% |
| Daily prison population | 53,864 | 54,629 | 54,767 | 53,704 | 51,794 | -4% | |
| Per inmate spending | $3,826 | $4,194 | $3,927 | $3,860 | $4,018 | 5% | |
| Percent of inmates age 55+ | 6.3% | 6.8% | 6.9% | 7.5% | 7.9% | 26% | |
| Alabama | Total spending* | $89,057 | $92,465 | $94,206 | $96,215 | $97,266 | 9% |
| Daily prison population | 28,760 | 25,523 | 26,179 | 25,841 | 25,806 | -10% | |
| Per inmate spending | $3,097 | $3,623 | $3,599 | $3,723 | $3,769 | 22% | |
| Percent of inmates age 55+ | 6.3% | 6.7% | 6.7% | 7.2% | 7.9% | 25% | |
| Florida | Total spending* | $409,646 | $443,595 | $416,244 | $427,795 | $424,592 | 4% |
| Daily prison population | 83,965 | 87,035 | 90,417 | 91,574 | 90,927 | 8% | |
| Per inmate spending | $4,879 | $5,097 | $4,604 | $4,672 | $4,670 | -4% | |
| Percent of inmates age 55+ | 7% | 7% | 7% | 8% | 9% | 29% | |
| South Carolina | Total spending* | $68,633 | $69,213 | $75,944 | $71,705 | $68,520 | 0% |
| Daily prison population | 23,437 | 23,958 | 24,081 | 24,105 | 23,358 | 0% | |
| Per inmate spending | $2,928 | $2,889 | $3,154 | $2,975 | $2,933 | 0% | |
| Percent of inmates age 55+ | 4.8% | 5.1% | 5.8% | 6.4% | 7% | 46% | |
| * In thousands. Source: The Pew Charitable Trusts, "State Prison Health Care Spending" | |||||||
State employees
- See also: State employee health plans
State employee health insurance accounts for the second-largest portion of state healthcare spending, behind only Medicaid. The total cost of insurance for state workers was $30.7 billion nationwide in 2013, with $25.1 billion paid for by the states. Premium costs varied widely, with higher premiums found in states such as New Hampshire and Vermont compared to those in states like Arkansas and Mississippi. Part of this variation is due to demographic factors and provider prices, and part may be attributed to differences in health plan "richness," or the cost sharing between the insurer and health plan enrollees, such as deductibles and copayments.[53]

| “ |
State health plans were generally "rich," paying on average 92 percent of the typical enrollees’ health care costs. By way of context, these plans would be designated "platinum" plans within the new health insurance marketplaces.[29] |
” |
| —The Pew Charitable Trusts | ||
Several states are experimenting with various cost-containment methods. "Pooled public employee health benefit programs" are one such strategy, which are mergers between state employee health plans and those of other, smaller public employers, such as city governments and school districts. The idea is to save on administrative costs for insurers and leverage the larger pool to negotiate lower premium rates. Evidence of cost savings is mixed, with the smaller public employers reaping most of the benefits. Programs for pooling public employee health plans have been implemented in 31 states; as of December 2014, Georgia was one of them. According to the National Conference of State Legislatures, the state allows public school districts to join its health plan.[54]
Georgia is one of 46 states that “self-fund at least one of their employee health care plans,” meaning that rather than purchasing insurance, the state pays health insurance claims with state and employee out-of-pocket insurance contributions while an insurer administers the benefits. As of 2013, there were 24 states offering plans with a $0 deductible; Georgia was not one of these states.[53][54]
Net state employee health plan expenditures in Georgia totaled $432.7 billion in 2013. This was not a significant change from net expenditures in 2011, which was $432.1 million. Georgia was the only state among its neighbors that experienced no change in such expenditures.[53]
Note: Due to such variations as demographics, plan richness and provider rates, "higher spending is not necessarily an indication of waste, and lower spending is not necessarily a sign of efficiency."[53]
| State employee health plan spending (in thousands) | |||||||
|---|---|---|---|---|---|---|---|
| State | Total state expenditures (gross) | Change | Total state expenditures (net) | Change | |||
| 2011 | 2013 | 2011 | 2013 | ||||
| Georgia | $562,834 | $596,437 | 6% | $432,056 | $432,725 | 0% | |
| Alabama | $319,012 | $299,038 | -6% | $244,199 | $222,317 | -9% | |
| Florida | $1,709,924 | $1,600,160 | -6% | $1,483,773 | $1,388,552 | -6% | |
| South Carolina | $398,741 | $423,073 | 6% | $289,021 | $310,733 | 8% | |
| United States | $30,311,259 | $30,692,147 | 1% | $25,263,863 | $25,071,413 | -1% | |
| Note: "Gross expenditures include employer and employee premium contributions. Net expenditures include only employer premium contributions. All spending figures are in 2013 dollars." Source: The Pew Charitable Trusts, "State Employee Health Plan Spending" | |||||||
In 2013, average state employee health plan premiums for single and family coverage were second highest in Georgia compared to neighboring states. The state paid on average 73 percent of the premiums, lower than the national average.[53]
| Average state employee health plan monthly premiums, 2013 | ||||||||
|---|---|---|---|---|---|---|---|---|
| State | Single | Family | Employer contribution percentage | Employee contribution percentage | ||||
| Total premium | Employer contribution | Employee contribution | Total premium | Employer contribution | Employee contribution | |||
| Georgia | $518 | $395 | $122 | $1,171 | $833 | $338 | 73% | 27% |
| Alabama | $383 | $298 | $85 | $1,038 | $763 | $275 | 74% | 26% |
| Florida | $549 | $500 | $50 | $1,242 | $1,063 | $179 | 87% | 13% |
| South Carolina | $408 | $311 | $98 | $851 | $616 | $235 | 73% | 27% |
| United States | $570 | $502 | $68 | $1,233 | $1,004 | $230 | 84% | 16% |
| Note: "Due to rounding, the sum of employer and employee contributions may differ from total premium." Source: The Pew Charitable Trusts, "State Employee Health Plan Spending" | ||||||||
| Back to top↑ |
Private insurance
- See also: Private health insurance
Premiums
For private insurance, consumers typically either receive coverage through their employer or buy it on their own through the individual market. As healthcare costs have increased, so have insurance premiums. Between 2000 and 2014, insurance premiums for employer-sponsored plans, including state and local government plans, increased 144 percent for single coverage and 161 percent for family coverage. However, the rate of increase has slowed in more recent years. Between 2000 and 2007, premiums grew by 81 percent for single coverage and 88 percent for family coverage. Between 2007 and 2014, the rates of increase were 34.5 percent and 39 percent, respectively.[55]
Employers have reacted to these costs in a number of ways, one of which has been to shift more responsibility for premium contributions to their employees. The portion of premiums paid by employees for single coverage has increased by four percentage points, from 14 percent to 18 percent, since 2000, and by three percentage points, from 26 percent to 29 percent, for family coverage. Average deductibles for employees have also risen, doubling from $584 to $1,135 between 2006 and 2013.[55][56]
In Georgia's private, employer-based insurance market, average premiums for employer-sponsored coverage amounted to $5,374 for single coverage and $14,762 for family coverage. These figures were below national averages. Employees contributed about $1,219 per year for single coverage and $4,435 for family coverage. As shown in the bar chart above, premiums in Georgia's individual market were second-lowest among its neighboring states, averaging at about $180 per month, or $2,163 per year.[57][58][59]
| Average annual premiums for private employer-based insurance, 2013 | |||||||
|---|---|---|---|---|---|---|---|
| State | Single | Family | |||||
| Employee contribution | Employer contribution | Total | Employee contribution | Employer contribution | Total | ||
| Georgia | $1,219 | $4,155 | $5,374 | $4,435 | $10,327 | $14,762 | |
| Alabama | $1,379 | $3,825 | $5,204 | $3,791 | $9,686 | $13,477 | |
| Florida | $1,408 | $3,975 | $5,383 | $5,653 | $10,417 | $16,070 | |
| South Carolina | $1,137 | $4,289 | $5,426 | $4,482 | $11,024 | $15,506 | |
| United States | $1,170 | $4,401 | $5,571 | $4,421 | $11,608 | $16,029 | |
| Note: "Figures may not sum exactly due to rounding." Source: The Henry J. Kaiser Family Foundation, "State Health Facts" | |||||||
In 2013, private sector employers in Georgia contributed on average 77.3 percent to single coverage premiums and 70 percent to family coverage premiums. Click on the table below to view further details and state comparisons.[60][61]
| Average annual premiums for private employer-based insurance, 2013 (percents) | |||||||
|---|---|---|---|---|---|---|---|
| State | Single | Family | |||||
| Employee contribution | Employer contribution | Total | Employee contribution | Employer contribution | Total | ||
| Georgia | 22.7% | 77.3% | 100% | 30% | 70% | 100% | |
| Alabama | 26.5% | 73.5% | 100% | 28.1% | 71.9% | 100% | |
| Florida | 26.2% | 73.8% | 100% | 35.2% | 64.8% | 100% | |
| South Carolina | 21% | 79% | 100% | 28.9% | 71.1% | 100% | |
| United States | 21% | 79% | 100% | 27.6% | 72.4% | 100% | |
| Note: Percentages calculated by Ballotpedia. Source: The Henry J. Kaiser Family Foundation, "State Health Facts" | |||||||
Competitiveness
The Henry J. Kaiser Family Foundation measured the competitiveness of the private health insurance market in 2013, using the Herfindahl-Hirschman Index (HHI) as an indicator. The HHI takes into account how much of a market is controlled by each of the companies competing within it (market share) and is expressed in a value between zero and 10,000. The lower the number, the more competitive the market. The analysis was divided into individual, small group and large group insurance markets. The data also includes information on the market share of the largest insurer in each state, as well as the number of insurers with a market share of greater than five percent.[62][63][64][65]
The individual, small group and large group insurance markets were more competitive in Georgia than in its neighboring states. Within the state, the small group market was the most competitive, with the largest insurer holding a market share of 28 percent.[62][63][64]
| Health insurance market competition, 2013 | |||||||||
|---|---|---|---|---|---|---|---|---|---|
| State | Individual | Small group | Large group | ||||||
| HHI* | Market share of largest insurer | Insurers with >5% market share | HHI* | Market share of largest insurer | Insurers with >5% market share | HHI* | Market share of largest insurer | Insurers with >5% market share | |
| Georgia | 2,465 | 36% | 3 | 2,278 | 28% | 4 | 2,512 | 42% | 5 |
| Alabama | 8,250 | 91% | 2 | 9,483 | 97% | 1 | 8,375 | 91% | 1 |
| Florida | 2,731 | 47% | 5 | 2,804 | 35% | 5 | 3,182 | 51% | 5 |
| South Carolina | 3,943 | 59% | 3 | 5,597 | 73% | 4 | 8,459 | 92% | 1 |
| United States | 3,888 | 55% | 3 | 3,841 | 57% | 4 | 4,038 | 57% | 4 |
| * "The Herfindahl-Hirschman Index (HHI) is a measure of how evenly market share is distributed across insurers in the market. HHI values range from 0 to 10,000, with an HHI closer to zero indicating a more competitive market and closer to 10,000 indicating a less competitive market. An HHI index below 1,000 generally indicates a highly competitive market; an HHI between 1,000 and 1,500 indicates an unconcentrated market; a score between 1,500 and 2,500 indicates moderate concentration; and a value above 2,500 indicates a highly concentrated (uncompetitive) market." Source: The Henry J. Kaiser Family Foundation, "State Health Facts" | |||||||||
| Back to top↑ |
Other sectors
Pharmaceuticals
- See also: Prescription drug sales by state
In the United States, there are more than 10,000 FDA-approved medicines available for doctors to prescribe or individuals to purchase over-the-counter. A major target of state healthcare cost-containment efforts is the price of these medicines. Prescription drugs generated a total of $259 billion in sales at retail pharmacies nationwide in 2014. Since generic drugs tend to be significantly less expensive than their brand name equivalents, all states allow pharmacists to dispense generics in place of brand name drugs for prescriptions. This practice is required in 13 states, except when a brand name drug is specifically ordered by a physician; this group of states does not include Georgia.[66]
Additionally, state Medicaid programs typically take a number of steps to control spending on pharmaceuticals. Most common are establishing preferred drug lists, which are prescription drugs that are automatically covered by the program, and negotiating rebates with manufacturers for both brand name and generic drugs. Georgia's Medicaid program utilized both of these strategies and was also part of a multi-state pool to enhance its buying power.[67]
In 2014, retail sales of prescription drugs at pharmacies in Georgia amounted to nearly $8 billion, with about 126.2 million drugs sold. On average, women and individuals over age 65 bought more prescription drugs than men and those under age 65. These totals do not include medications sold over-the-counter.[68][69][70][71]
| Prescription drugs filled at retail pharmacies, 2014 | ||||||||
|---|---|---|---|---|---|---|---|---|
| State | Total sales for retail Rx drugs | Total number retail Rx drugs | Number per capita by age | Number per capita by gender | ||||
| Ages 0-18 | Ages 19-64 | Ages 65+ | Male | Female | ||||
| Georgia | $7,963,555,676 | 126,152,436 | 4.1 | 12.5 | 32.2 | 10.3 | 15 | |
| Alabama | $5,166,108,990 | 84,280,150 | 5.6 | 17.6 | 36.1 | 14.3 | 20.5 | |
| Florida | $15,583,530,624 | 248,850,279 | 4.1 | 11.8 | 25.9 | 10.8 | 14.6 | |
| South Carolina | $4,307,039,712 | 65,020,119 | 4.8 | 13.5 | 28.5 | 11.1 | 16.2 | |
| United States | $259,092,876,285 | 4,002,661,750 | 4.1 | 12.6 | 27.9 | 10.4 | 14.9 | |
| Note: "These totals include prescriptions filled at pharmacies only and a small portion of over-the-counter medications and repackagers and exclude those filled by mail order." Source: The Henry J. Kaiser Family Foundation, "State Health Facts" | ||||||||
Monitoring programs
States are also focusing on curbing prescription drug abuse and fraud as a method to contain costs.[72]
| “ |
According to the Coalition Against Insurance Fraud, prescription drug misuse, abuse and fraud cost private health insurers almost $25 billion a year.[29] |
” |
| —National Conference of State Legislatures | ||

Between 2004 and 2009, there was a documented increase of 98.4 percent in emergency room visits caused by such abuse and misuse of prescription drugs. As an effort to combat the rise in prescription drug abuse and fraud, all but two states have authorized the development of prescription drug databases that can monitor the dispensing of certain controlled substances. These programs have been bolstered by federal grants encouraging their implementation.[72]
Georgia has an operational prescription drug monitoring program that monitors the dispensing of Schedule II, Schedule III, Schedule IV and Schedule V drugs. Information must be reported weekly by individuals and entities that are authorized to dispense such drugs. These requirements exclude pharmacies within hospitals or other healthcare facilities that dispense only to inpatients, pharmacies within correctional facilities, and practitioners that administer drugs directly to a patient. The law does not require patients to be notified of the monitoring program.[73]
Right to try
Under the current model, access to experimental drugs by terminally ill patients is controlled by the Food and Drug Administration (FDA), which must give its approval after it receives a form from a patient's physician. What are known as "right to try" laws aim to allow such patients to gain access to experimental drugs without the permission of the FDA. As of March 2016, 27 states in total had adopted right-to-try legislation. At that time, Georgia legislators had considered right-to-try bill legislation, but no such bill had been passed.[74]
Health information technology
| The HHS on the HIPAA Privacy Rule |
Health information technology (IT) refers to electronic systems that manage, store and transmit health information, such as patient records. The adoption of modernized health IT has been promoted by the federal government as a way to increase quality while decreasing costs. For instance, the American Recovery and Reinvestment Act of 2009 required most health providers to adopt electronic health records by 2015. However, the digitization of health data raises concerns about the privacy of such data, which could be vulnerable to a breach if not properly secured. Since 1996, health IT privacy and security has been governed by the Health Insurance Portability and Accountability Act (HIPAA), which required and set national standards for the confidentiality of patient information "when it is transferred, received, handled, or shared."[75][76][77]
All-payer claims databases are one form of health IT that a growing number of states are implementing to track healthcare costs. All-payer claims databases are state systems for collecting data from public and private health insurance claims on demographics, types of services and total charges. According to the National Conference of State Legislatures, "the U.S. Department of Health and Human Services plans to build a nationwide all-payer claims database consisting of a representative sample of the population." All-payer claims databases exist in 17 states, while another 17 have demonstrated a "strong interest" in creating one. To view the status of such a program in Georgia, click here.[78][79][80][81]
| Back to top↑ |
Studies
Citizen health

Each year, the United Health Foundation releases a report titled "America's Health Rankings," which measures the overall health of the citizens in each state. The United Health Foundation is a nonprofit organization that "provides helpful information to support decisions that lead to better health outcomes and healthier communities." Factors taken into account for the report include the percentage of the state population that smokes tobacco, incidents of infectious diseases such as Salmonella, percent of the population uninsured, the number of primary care physicians, and the rate of infant mortality, among others.[82][83]
In its 2014 report, Georgia ranked 38th in the nation, down from 36th in 2012. According to the report, although the state had a low prevalence of binge drinking and drug-related deaths, it also had a low high school graduation rate, a high prevalence of low birthweights and a limited availability of dentists.[82]
Compared to neighboring states, Georgia ranked below Florida (32nd), but above South Carolina (42nd) and Alabama (43rd). To read the full report, click here.[82]
Recent legislation
The following is a list of recent healthcare policy bills that have been introduced in or passed by the Georgia state legislature. To learn more about each of these bills, click the bill title. This information is provided by BillTrack50 and LegiScan.
Note: Due to the nature of the sorting process used to generate this list, some results may not be relevant to the topic. If no bills are displayed below, then no legislation pertaining to this topic has been introduced in the legislature recently.
Ballot measures
| Voting on Healthcare |
|---|

|
| Ballot Measures |
| By state |
| By year |
| Not on ballot |
| Local Measures |
- See also: Healthcare on the ballot and List of Georgia ballot measures
Ballotpedia has tracked the following ballot measures relating to healthcare matters in Georgia.
- Georgia Trauma Care Funding, Amendment 2 (2010)
- Georgia Ware County Hospital Bonds, Amendment 3 (1928)
- Georgia Stephens County Hospital Bonds, Amendment 1 (1930)
- Georgia Hospital Contracts, Amendment 21 (June 1941)
- Georgia City of Gainesville Hospital Contracts, Amendment 30 (1950)
- Georgia Medical School Scholarships, Amendment 4 (1952)
- Georgia Richmond County Board of Health, Amendment 26 (1952)
- Georgia Macon-Bibb County Health Board, Amendment 13 (1954)
- Georgia Repayment of Medical Loans, Amendment 13 (1960)
- Georgia Repayment of Medical Loans, Amendment 8 (1962)
- Georgia Medical Loan Repayment, Amendment 10 (1964)
- Georgia Medical Loan Repayment, Amendment 15 (1966)
- Georgia Medical School Loans, Amendment 10 (1968)
- Georgia Tax Exemptions for Healthcare Facilities, Amendment 8 (1970)
- Georgia Tax Exemptions for Hospitals, Amendment 10 (1972)
- Georgia Medical School Loans, Amendment 12 (1976)
- Georgia Indigent Care Trust Fund, Amendment 14 (1988)
- Georgia Indigent Care Trust Fund, Amendment 3 (1992)
- Georgia Healthcare Contracts, Amendment 3 (1994)
Recent news
The link below is to the most recent stories in a Google news search for the terms Georgia healthcare. These results are automatically generated from Google. Ballotpedia does not curate or endorse these articles.
See also


External links
- State Health Benefit Plan (Division of Georgia Department of Community Health)
- The Henry J. Kaiser Family Foundation
- National Conference of State Legislatures, Health
- Health Affairs
Additional reading
- The Henry J. Kaiser Family Foundation, "Health Care Costs: A Primer"
- Deloitte Center for Health Solutions, "Dig deep: Impacts and implications of rising out-of-pocket health care costs"
- The Pew Charitable Trusts, "State Health Care Spending Project Reports"
Back to top↑
Footnotes
- ↑ 1.0 1.1 National Conference of State Legislatures, "Health," accessed July 8, 2015
- ↑ 2.0 2.1 2.2 2.3 Fillmore, R., Florida Science Communications, Inc., "The Evolution of the U.S. Healthcare System," accessed July 8, 2015
- ↑ History, "George Waring," accessed July 27, 2015
- ↑ University of Houston: Digital History, "The Growth of Cities," accessed July 27, 2015
- ↑ NPR, "Accidents Of History Created U.S. Health System," October 22, 2009
- ↑ The Economist, "The insured and the unsure," January 26, 2013
- ↑ NPR, "Health Care In America: Follow The Money," March 19, 2012
- ↑ National Center for Biotechnology Information, "Why Is Health Care Regulation So Complex?" October 2008
- ↑ Center on Education and the Workforce, "Healthcare," June 2012
- ↑ Ensocare, "How Demographics Impact Health-care Delivery," accessed July 10, 2015
- ↑ The Henry J. Kaiser Family Foundation, "Total Number of Residents," accessed July 17, 2015
- ↑ Henry J. Kaiser Family Foundation, "Population Distribution by Age," accessed July 17, 2015
- ↑ Henry J. Kaiser Family Foundation, "Population Distribution by Gender," accessed July 17, 2015
- ↑ Academy Health, "Impact of the Economy on Health Care," August 2009
- ↑ The Conversation, "Budget explainer: What do key economic indicators tell us about the state of the economy?" May 6, 2015
- ↑ Health Affairs, "Socioeconomic Disparities In Health: Pathways And Policies," accessed July 13, 2015
- ↑ The Henry J. Kaiser Family Foundation, "Distribution of Total Population by Federal Poverty Level," accessed July 17, 2015
- ↑ The Henry J. Kaiser Family Foundation, "Median Annual Household Income," accessed July 17, 2015
- ↑ The Henry J. Kaiser Family Foundation, "Unemployment Rate (Seasonally Adjusted)," accessed July 17, 2015
- ↑ The Henry J. Kaiser Family Foundation, "Total Gross State Product (GSP) (millions of current dollars)," accessed July 17, 2015
- ↑ 21.0 21.1 Health Affairs, "Employment-Based Health Insurance: Past, Present, And Future," November 2006
- ↑ The Henry J. Kaiser Family Foundation, "Health Insurance Coverage of the Total Population," accessed July 23, 2015
- ↑ Robert Wood Johnson Foundation, "State-Level Trends in Employer-Sponsored Health Insurance," January 29, 2015
- ↑ The Pew Charitable Trusts, "State Health Care Spending on Medicaid," July 2014
- ↑ Centers for Medicare and Medicaid Services, "National Health Expenditures 2013 Highlights," accessed July 28, 2015
- ↑ Health Affairs, "National Health Spending In 2013: Growth Slows, Remains In Step With The Overall Economy," December 2014
- ↑ Health Affairs, "National Health Expenditure Projections, 2013–23: Faster Growth Expected With Expanded Coverage And Improving Economy," September 2014
- ↑ Peterson-Kaiser Health System Tracker, "Health Spending Explorer," accessed July 28, 2015
- ↑ 29.0 29.1 29.2 29.3 Note: This text is quoted verbatim from the original source. Any inconsistencies are attributable to the original source.
- ↑ Health Affairs, "The Rise In Health Care Spending And What To Do About It," November 2005
- ↑ National Conference of State Legislatures, "Equalizing Health Provider Rates," June 2010
- ↑ The Henry J. Kaiser Family Foundation, "Health Care Expenditures by State of Residence (in millions)," accessed July 17, 2015
- ↑ The Henry J. Kaiser Family Foundation, "Health Care Expenditures per Capita by State of Residence," accessed July 17, 2015
- ↑ The Henry J. Kaiser Family Foundation, "Average Annual Percent Growth in Health Care Expenditures by State of Residence," accessed July 17, 2015
- ↑ The Henry J. Kaiser Family Foundation, "Distribution of Health Care Expenditures by Service by State of Residence (in millions)," accessed August 27, 2015
- ↑ The Henry J. Kaiser Family Foundation, "Total Medicaid Spending," accessed July 17, 2015
- ↑ Medicaid and CHIP Payment and Access Commission, "Medicaid Benefit Spending per Full-Year Equivalent Enrollee by State and Eligibility Group, FY 2012," accessed September 14, 2015
- ↑ The Pew Charitable Trusts, "State Health Care Spending on Medicaid" Table B.1, accessed July 17, 2015
- ↑ The Henry J. Kaiser Family Foundation, "Federal and State Share of Medicaid Spending," accessed July 17, 2015
- ↑ National Association of State Budget Officers, "State Expenditure Report: Examining Fiscal 2011-2013 State Spending: Table 5," accessed July 17, 2015
- ↑ The Henry J. Kaiser Family Foundation, "Distribution of Medicaid Spending by Service," accessed July 17, 2015
- ↑ The Pew Charitable Trusts, "State Health Care Spending on Medicaid," July 2014
- ↑ The Henry J. Kaiser Family Foundation, "Total Medicare Spending by State (in millions)," accessed July 17, 2015
- ↑ The Henry J. Kaiser Family Foundation, "Average Annual Percent Growth in Medicare Spending, by State," accessed July 17, 2015
- ↑ The Henry J. Kaiser Family Foundation, "Medicare Spending Per Enrollee, by State," accessed July 17, 2015
- ↑ The Henry J. Kaiser Family Foundation, "Average Annual Percent Growth in Medicare Spending per Enrollee, by State," accessed July 17, 2015
- ↑ The Henry J. Kaiser Family Foundation, "Total Number of Medicare Beneficiaries," accessed July 17, 2015
- ↑ The Henry J. Kaiser Family Foundation, "Medicare Beneficiaries as a Percent of Total Population," accessed July 17, 2015
- ↑ The Henry J. Kaiser Family Foundation, "Distribution of Medicare Beneficiaries by Eligibility Category," accessed July 17, 2015
- ↑ Medicaid.gov, "Seniors & Medicare and Medicaid Enrollees," accessed July 16, 2015
- ↑ The Henry J. Kaiser Family Foundation, "Distribution of Medicaid Spending for Dual Eligibles by Service (in Millions)," accessed July 17, 2015
- ↑ 52.0 52.1 The Pew Charitable Trusts, "State Prison Health Care Spending," July 2014
- ↑ 53.0 53.1 53.2 53.3 53.4 The Pew Charitable Trusts, "State Employee Health Plan Spending," August 2014
- ↑ 54.0 54.1 National Conference of State Legislatures, "State Employee Health Benefits," accessed July 20, 2015
- ↑ 55.0 55.1 The Henry J. Kaiser Family Foundation, "Employee Health Benefits: 2014 Annual Survey," accessed July 24, 2015
- ↑ The Henry J. Kaiser Family Foundation, "FAQ: How Employer-Sponsored Health Insurance Is Changing," September 17, 2013
- ↑ The Henry J. Kaiser Family Foundation, "Average Single Premium per Enrolled Employee For Employer-Based Health Insurance," accessed July 24, 2015
- ↑ The Henry J. Kaiser Family Foundation, "Average Family Premium per Enrolled Employee For Employer-Based Health Insurance," accessed July 24, 2015
- ↑ The Henry J. Kaiser Family Foundation, "Average Monthly Premiums Per Person in the Individual Market," accessed July 24, 2015
- ↑ The Henry J. Kaiser Family Foundation, "Average Single Premium per Enrolled Employee For Employer-Based Health Insurance," accessed July 17, 2015
- ↑ The Henry J. Kaiser Family Foundation, "Average Family Premium per Enrolled Employee For Employer-Based Health Insurance," accessed July 17, 2015
- ↑ 62.0 62.1 The Henry J. Kaiser Family Foundation, "Individual Insurance Market Competition," accessed July 24, 2015
- ↑ 63.0 63.1 The Henry J. Kaiser Family Foundation, "Small Group Insurance Market Competition," accessed July 24, 2015
- ↑ 64.0 64.1 The Henry J. Kaiser Family Foundation, "Large Group Insurance Market Competition," accessed July 24, 2015
- ↑ Investopedia, "Herfindahl-Hirschman Index - HHI," accessed August 6, 2015
- ↑ National Conference of State Legislatures, "Use of Generic Prescription Drugs and Brand-Name Discounts," June 2010
- ↑ National Conference of State Legislatures, "Prescription Drug Agreements and Volume Purchasing," June 2010
- ↑ The Henry J. Kaiser Family Foundation, "Total Retail Sales for Prescription Drugs Filled at Pharmacies," accessed July 21, 2015
- ↑ The Henry J. Kaiser Family Foundation, "Total Number of Retail Prescription Drugs Filled at Pharmacies," accessed July 21, 2015
- ↑ The Henry J. Kaiser Family Foundation, "Retail Prescription Drugs Filled at Pharmacies (Annual per Capita by Age)," accessed July 21, 2015
- ↑ The Henry J. Kaiser Family Foundation, "Retail Prescription Drugs Filled at Pharmacies (Annual per Capita by Gender)," accessed July 21, 2015
- ↑ 72.0 72.1 National Conference of State Legislatures, "The Burden of Prescription Drug Overdoses on Medicaid," January 2012
- ↑ National Alliance for Model State Drug Laws, "Prescription Monitoring Program State Profiles – Georgia," accessed July 21, 2015
- ↑ National Conference of State Legislatures, "'Right to Try' Experimental Prescription Drugs State Laws and Legislation for 2014 & 2015," March 31, 2015
- ↑ California Department of Health Care Services, "Health Insurance Portability and Accountability Act," accessed August 4, 2015
- ↑ U.S. Department of Health and Human Services, "Health Information Technology," accessed August 8, 2015
- ↑ U.S. Department of Health and Human Services, "Health Information Technology," accessed August 4, 2015
- ↑ The Commonwealth Fund, "All-Payer Claims Databases: State Initiatives to Improve Health Care Transparency," September 2010
- ↑ Governing, "More States Create All-Payer Claims Databases," February 4, 2014
- ↑ APCD Council, "Frequently Asked Questions," accessed August 4, 2015
- ↑ National Conference of State Legislatures, "Collecting Health Data: All-Payer Claims Databases," May 2010
- ↑ 82.0 82.1 82.2 United Health Foundation, "America's Health Rankings," December 2014
- ↑ United Health Foundation, "About the United Health Foundation," accessed July 27, 2015